Plot BayesDCA comparison
Usage
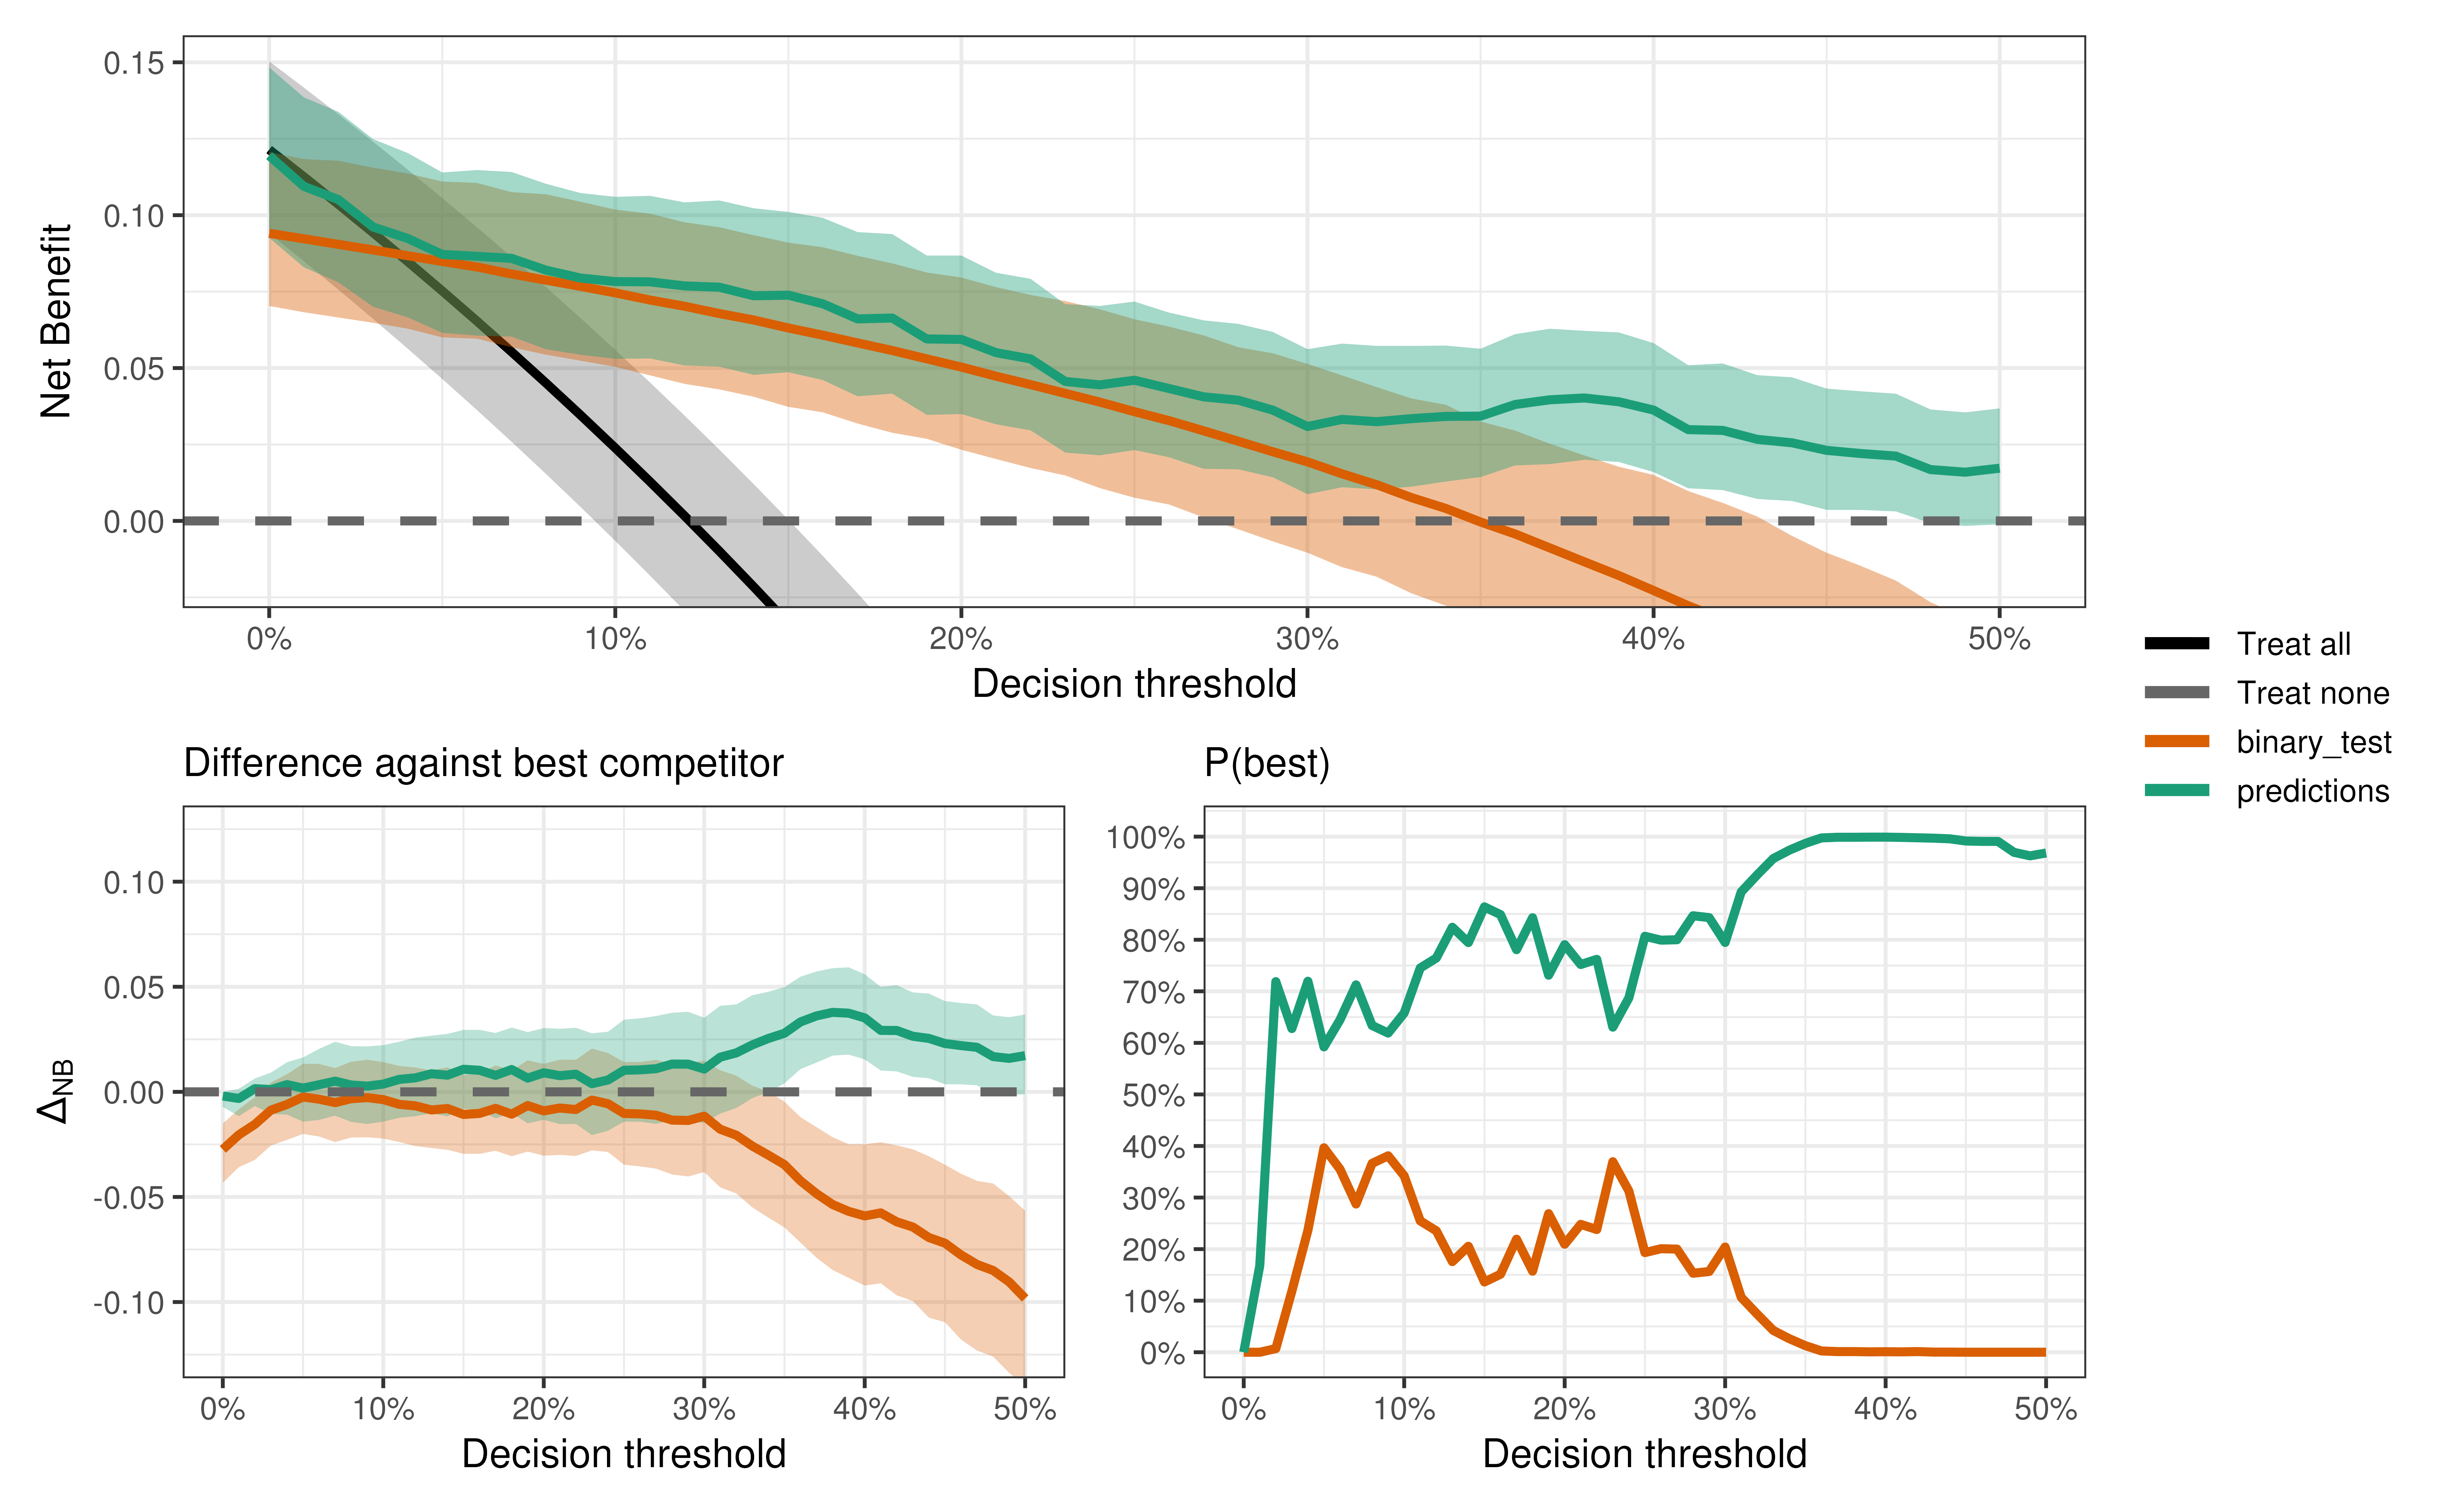
compare_dca(
  obj,
  strategies = NULL,
  colors = NULL,
  labels = NULL,
  plot_list = FALSE,
  .evpi = FALSE,
  type = c("best", "useful", "pairwise"),
  linewidth = 1.5,
  ...
)
Arguments
- obj
BayesDCA or BayesDCASurv object
- strategies
Character vector with models or tests to plot. If null, compares either first two in
obj$strategiesor the first one against Treat all/none (if only one available).- colors
Named vector with color for each model or test. If provided for a subset of models or tests, only that subset will be plotted.
- labels
Named vector with label for each model or test.
- plot_list
If TRUE, returns a list of separate ggplot objects.
- .evpi
If TRUE, adds validation EVPI to plots -- see Sadatsafavi et al. (2020)(see https://arxiv.org/abs/2208.03343).
- type
One of "best", "useful", or "pairwise".
- linewidth
Width of plotted lines.